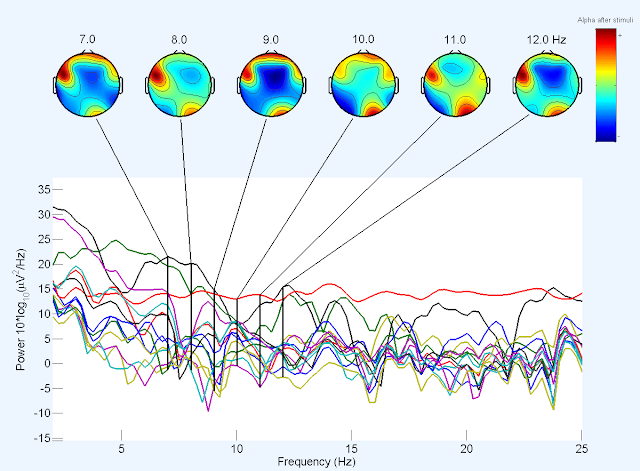
My previous post ended with some statistics now I proceed to the analysis of the retrieved signals. The results and the measurement itself is rather instructive than useful and practical, so if you are interested in a working solution I have to disappoint you. I'm planning a measurement concept that is going to be much simpler and going to look at the problem from a different perspective. Also as I dived more into the literature, I found that there was no need for the 3-minute calm part, there was rather need for the measurements immediately before and after the effects played.
Hypothesis to test - frontal alpha asymmetry
Pattern of asymmetrical frontal EEG activity is found to distinguish positive (happiness, joy) from negative (fear, anger) emotions by Hell and Nitschke [James A. Coan, 2004]. Although, this hypothesis turned out to be false (at least other more supported hypothesis came), and instead some showed that it would be the indicator of valence - greater right frontal activity (which means greater left alpha power) compared to the left frontal activity indicates approach or engage stimulus and greater left frontal activity infer tendency to withdrawal stimulus. This is called Davidson's approach/withdrawal model [Davidson, 1993]. Here I should point out that activity is inversely related to alpha power, which means lower power reflects more activity and vice versa.

Alpha power means the values of the signal converted to frequency domain at 7 to 12 Hz. Here is the alpha power spatial representation of a fearful (withdrawal stimulus) person playing a horror game - not part of the main measurements. Here the alpha asymmetry model actually worked.

